GDP is an aggregate measure of total economic production and represents the market value of all goods and services produced by an economy during the period measured.
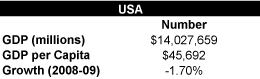
The Nation’s Gross Domestic Product (GDP) in 2009, the latest data available from the Bureau of Economic Analysis, was over $14 trillion, with a GDP per Capita of $45,692. The 2010 GDP figures (advanced estimates) will be available in June 2011.
By hovering over the States in the map below, you are able to explore how each state measures up.
A few highlights include:
- The 5 states with the highest GDP include California, Texas, New York, Florida and Illinois. The GDP of the top five states is over 5.5 trillion, which makes up 39% of the Country’s total output in dollars.
- Wyoming has the highest GDP per capita at $68,830, while it ranks 47 in total GDP at 37.4 billion.
- The states posting the greatest gains in GDP from 2008 to 2009 include South Dakota, Oklahoma, Delaware, North Dakota, West Virginia, and Virginia, respectively. These states exceeded aggregate U.S. GDP growth by 86% to 124% over this time period.

|
